Amazon identified that every 100ms delay led to a 1% loss in sales. This was famously the reason why AWS was built. Anyway, this statistic is repeatedly brought up in the tech circles and for valid reasons.
Revenue is impacted when page loading is delayed.
Users notice. Frustration peaks.
Performance is not just a technical concern today. It has a major impact on user trust, brand perception, and revenue.
Say, you are launching an application without understanding how it behaves under real user load. That’s where tools like JMeter make a mark.
I remember projects where everything looked perfect in the development phase. Clean UI, fast APIs, zero visible issues. Then actual users began using it – suddenly, delays crept in, timeouts started appearing, errors popped up everywhere. The system was overwhelmed by concurrent requests. These incidents made me reconsider how I view performance testing.
| Key Takeaways: |
|---|
|
This is exactly why understanding JMeter overview, features, and advantages is so important.
What is JMeter (A simple overview)?
Built around simplicity, Apache JMeter is an open-source performance testing tool. It is used to simulate multiple users at once using an application. Instead of guessing performance, it tracks responses when traffic ramps up. Though free to use, its real job is watching how systems react when pushed. From setup onward, behavior under pressure becomes clear through repeated trials.
In simple terms, JMeter helps you answer questions like: Is your setup ready for a thousand people using it at once? Or what happens if traffic suddenly spikes? Or what part of my app takes longer to respond?
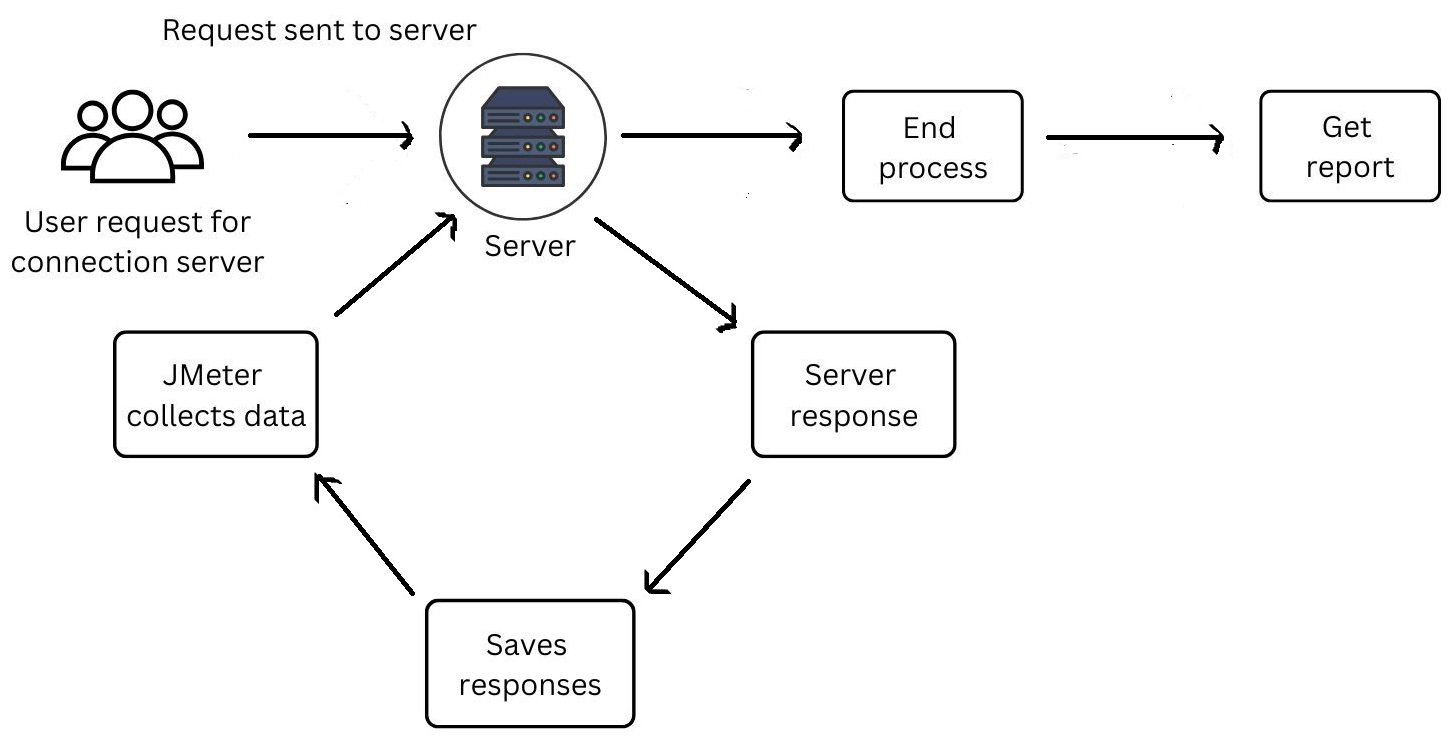
JMeter works by sending requests (like HTTP or API calls) to a server and then recording how the server responds. Patterns form as numbers stack, revealing strain points hiding beneath steady surfaces. Metrics like response time, throughput, and error rates are captured and analyzed.
The requests are generated and executed without using a real browser.
Here’s why that matters. Unlike a browser, JMeter skips drawing pages entirely. Because of this, it runs tests quickly – yet certain behaviors won’t show up right away.
How JMeter Works in Real Projects
Understand JMeter in a simpler manner.
- Test Plan: The overall structure that defines what will be tested
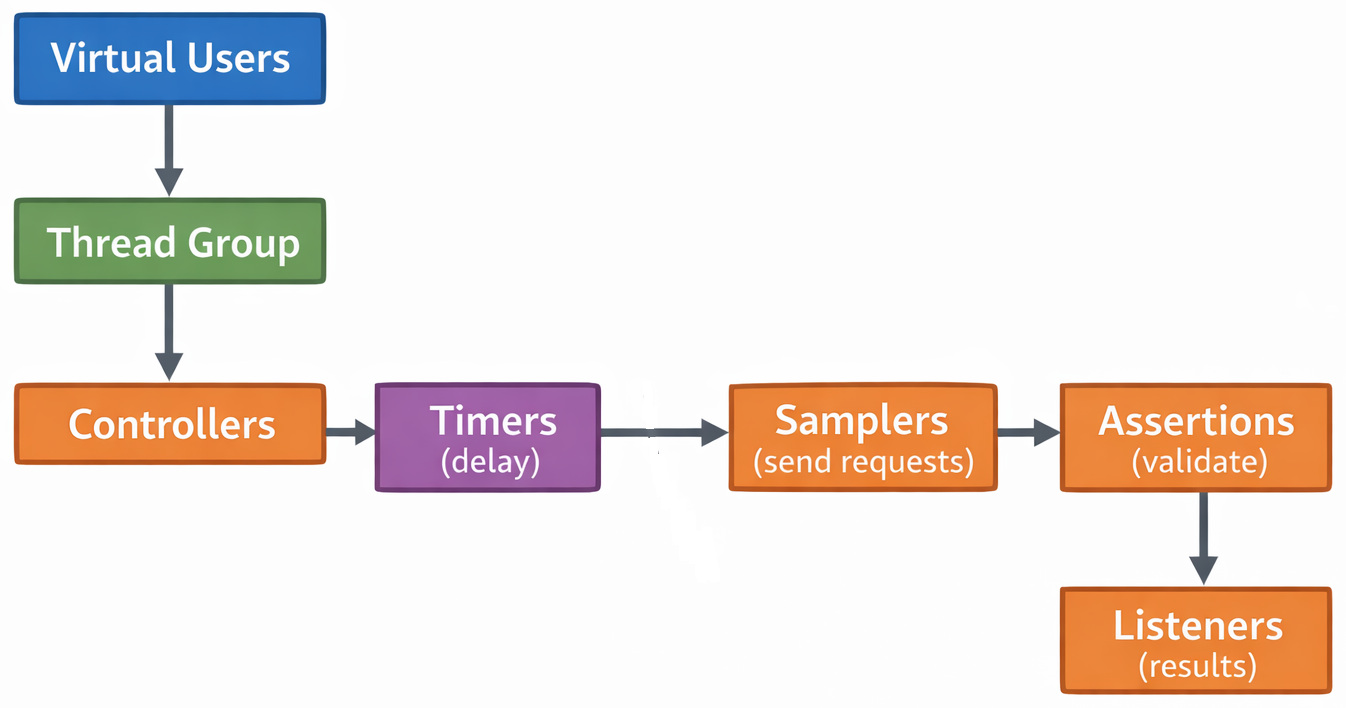
- Thread Group: Defines the number of users, ramp-up time, and loops
- Samplers: Send requests (HTTP, API, DB, etc.)
- Controllers (Logic Controllers): Control the flow of execution
- Listeners: Display results (graphs, tables, logs)
- Timers: Add delays between requests
- Assertions: Validate responses
- Configuration Elements: Set variables, headers, cookies
- The Thread Group starts virtual users
- Controllers decide the execution flow
- Timers introduce delays (to simulate real users)
- Samplers send requests to the server
- Assertions validate responses
- Listeners collect and display results
When testing goes wrong in actual use, it’s typically because the setup misses key details. Say a team sets up 10,000 virtual users – yet skips adding a configurable, realistic think time. This causes unrealistic load and misleading conclusions.
Sometimes it happens that when the performance issues were blamed on the backend, the actual cause sat in flawed testing code. Incorrect test scripts made things look broken elsewhere.
The results were misinterpreted due to an incorrect test configuration.
Key Features of JMeter
What stands out next are JMeter’s capabilities – its strengths become clear right here.
1. Multi-Protocol Support
JMeter supports a wide range of protocols such as HTTP / HTTPS, REST APIs, SOAP services, FTP, JDBC, and JMS. It is a versatile tool. Not stuck to only web apps, try it on APIs, databases, or messaging setups too.
2. Load and Performance Testing Features
JMeter is widely used for load testing, stress testing, and spike testing. Flood your app with simulated visitors, watching how it holds up under pressure. A sudden traffic peak reveals the weak spots fast. Performance may slow down, but it does not always break. Each test opens a window into real-world strain situations.
Here’s a detail that might catch your attention. In theory, it seems fine. But actually creating a heavy load from one machine? That rarely works smoothly. Distributed tests are often needed.
3. Distributed Testing
Multiple machines can join a test when JMeter takes charge. Running checks at once becomes possible through linked systems.
- You want to simulate global traffic
- Your local system cannot generate enough load
One time, I handled a project involving simulated traffic across multiple geographical regions. JMeter’s distributed setup made it possible. However, it is worth noting that the configuration came with its own set of surprising challenges.
4. User-friendly GUI with Command Line Option (CLI) Mode
Starting off simple, JMeter comes with visuals you can click through. Its layout helps newcomers get going without confusion.
Here’s what most people get surprised about: Some teams tend to overlook that the GUI mode consumes a lot of memory. When test sizes grow, skip the visuals and run without the display instead (i.e., non-GUI mode).
Faster results can be achieved through running tests in CLI mode.
5. Extensibility Through Plugins
These plugins boost JMeter’s capabilities. Through them, users gain extra features such as adding custom graphs, extending functionality, and integrating with CI/CD pipelines.
This flexibility is one of its biggest strengths.
6. Detailed Reporting and Analysis
JMeter provides graphs, tables, and dashboards as part of its reporting features. Finding patterns in how things run becomes easier because of these. One important thing is that JMeter cannot render JS scripts or HTML, so it creates and sends requests to target servers. Retrieves info from the server and displays it in a chart or graph. Test results are generated in formats such as text, JSON, or XML.
Truth is, raw reports might feel a bit much at times. Users usually export results and analyze them further using individual tools when deeper insights are needed.
Advantages of JMeter
- Open Source and Free: A huge deal, really. JMeter is completely free. No restrictions. This tool is best suited for small teams and startups for whom open-source tools are a big deal.
- Platform Independence: JMeter is Java-based and runs on Windows, Linux, and macOS. Basically, this tool can be executed on any system that has Java installed.
Thus, it makes the tool accessible to almost everyone.
- Strong Community Support: As it is open-source, users prefer JMeter. Their shared work keeps things moving forward together. You are provided with tutorials, plugins, and forums. Whenever a user gets stuck, chances are someone else has already faced the same issue.
- Flexibility in Testing: JMeter is versatile in use and can be used for multiple testing types, such as API testing, database testing, and performance testing. Thus, it makes JMeter a multi-purpose tool.
- Scalability: When it needs to, JMeter handles heavy traffic by simulating large user loads.
Still, here’s what matters most. Reality hits hard once hardware limitations get overlooked. Just because JMeter claims to simulate 100,000 users doesn’t mean your system running JMeter can handle it.
- Integration Capabilities: JMeter integrates well with CI/CD tools, monitoring tools, and other testing frameworks. This makes it suitable for modern DevOps workflows.
Real-World Challenges and Limitations
No tool is perfect, and JMeter carries its share, too.
1. Not a real browser. JMeter does not execute JavaScript or render UI.
- Frontend performance is not tested
- Browser-specific issues are ignored
The client-side behavior is not captured during tests.
2. JMeter is resource-intensive. A single JMeter test might demand a lot of memory and CPU. System performance dips in large-scale tests.
3. It has a steep learning curve (for advanced use). Getting started feels simple enough. It works without much effort. But advanced scenarios like linked data, parametrization, or distributed testing often get tricky. Details pile up quickly without warning. Beginners struggle in this situation.
Read: AI in Performance Testing: Tools to Consider.
When is it Good to Use JMeter?
- You need a free performance testing tool
- You want to test APIs or backend systems
- You are comfortable with some level of technical setup
- You need a real browser simulation
- You want a fully managed, enterprise solution
- Your team lacks performance testing expertise
JMeter Example
There was a project where performance testing kept getting pushed due to tight deadlines. In staging, everything looked fine: APIs were fast, and no major issues showed up during basic testing.
So, the team moved ahead. On launch day, traffic started rising.
- API response times increased
- Errors started appearing
- Users began dropping off
The application failed to handle production load.
At first, the issue wasn’t obvious. Different teams had different assumptions, but there was no clarity.
That’s when JMeter was introduced.
- One API slowed down significantly under load
- Database queries began stacking up
The root cause?
A poorly optimized database query that worked fine under low traffic, but failed under pressure. The bottleneck was exposed only when a realistic load was simulated. The annoying truth was that it could have been caught much earlier.
Learning from the incident: In real projects, this usually breaks when performance testing is overlooked or rushed. This sounds fine during development. But production traffic behaves very differently. And by the time issues appear, users are already impacted.
So, is JMeter Worth Learning?
Absolutely, but you need to manage your expectations.
Strong tools often come with limits; JMeter does not. You build tests your way, without rigid rules blocking choices.
- Proper understanding
- Careful test design
- Realistic expectations
Fine in theory, yet real results with JMeter hinge on skillful handling. Still, its power shows only when applied thoughtfully.
Finding your way into performance testing? Then exploring JMeter makes sense. A solid move comes next when effort meets tool knowledge.
And if you’re someone who has seen systems fail under load, you’ll know why tools like this are not optional anymore.
Conclusion
To wrap it up, JMeter is a powerful open-source performance testing tool that offers multi-protocol support, scalability, reporting, and extensibility while being a tool that is free, flexible, and widely supported.
Beyond all of this, JMeter’s true value lies in what it helps to prevent. As in the real world, performance anomalies are not just technical bugs; they are business problems waiting to explode.
Frequently Asked Questions (FAQs)
What is JMeter used for in real-world projects?
A: JMeter is mainly used for performance and load testing of applications, especially APIs and web services.
Is JMeter easy to learn for beginners?
A: It depends. The basics are easy; you can create a simple test in minutes. But once you move to advanced concepts like correlation or distributed testing, things get a bit complex.
What is one common mistake teams make while using JMeter?
A: A big one is an unrealistic load simulation. Teams often skip adding “think time” between requests. This creates unnatural traffic patterns.